Anatomy of a Successful ACO: Part 1
In 2014 Centers for Medicare & Medicaid Services (CMS) paid $315.9 million to 52 of the 220 Accountable Care Organizations (ACO) for delivering quality care and savings relative to a risk adjusted benchmark. Of interest to the Splash Analytics team was determining the factors that distinguished a “successful” ACO from an “unsuccessful” ACO using the 2013 performance year data published by CMS. We will be presenting our findings as a series of three blog posts. In this first post, we sought to characterize the relationships between ACO size and expenditure benchmarks (set by CMS) and the probability an ACO was “successful”. In our next post we will discuss the cost and utilization patterns that are associated with successful ACOs. We will conclude our blog series with an analysis of the three way relationship between clinical quality scores, utilization, and ACO success. Each post will begin with a brief summary of key findings that are then developed in detail.
In these posts, we have defined an “Achieving” ACO as one in which the ACO’s quality scores were high enough to be eligible for shared savings, and shared savings were achieved (expenditures attributed to the ACO were below the benchmark set by CMS). The non-achieving ACOs were further broken down into two groups: ACOs with quality scores too low to be eligible (called Q-) and ACOs with sufficient quality scores, but attributed expenditures over benchmark (called Q+S-). The distribution of ACO’s was as follows: 52 ACOs were “Achieving”, 157 ACOs were in the Q+S- group, and 11 ACOs were in the Q- group.
1. ACO size does matter. Smaller ACOs struggled with achieving quality scores. For ACOs that did meet the quality score requirement to participate in shared savings, size was not associated with achievement of shared savings.
2. Expenditure benchmark does predict final success. Each $1,000 increase in an ACO’s per-person expenditure benchmark was associated with a 15% increase in the odds of achieving savings for the ACOs with sufficient quality scores.
3. Proportion of non-Caucasian members, proportion of members qualifying for Medicare due to end stage renal disease, and proportion of disabled members were all positively associated with the poor clinical quality group (Q-), but did not differentiate between the ACOs that did meet quality score benchmarks.
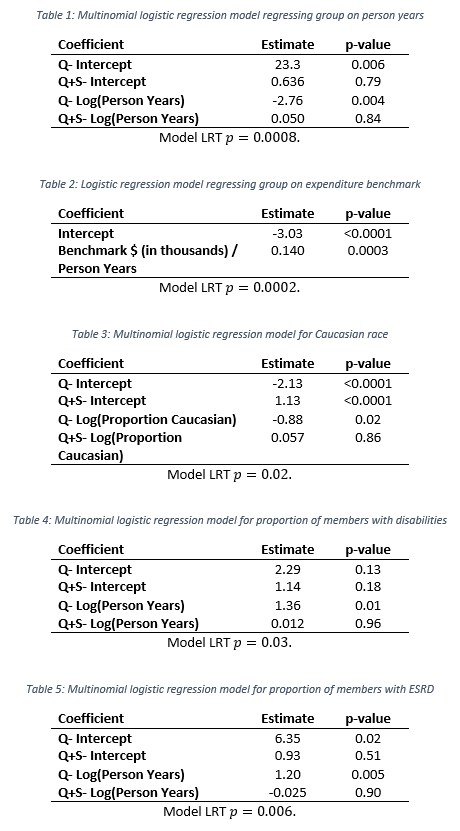
One of the most straightforward questions to ask was whether a relationship exists between the size of an ACO and whether shared savings was achieved. We explored this using multinomial logistic regression. Multinomial logistic regression models the probability that a data point (in this case an ACO) originates from one of 2 or more groups (in this case Achieving, Q-, or Q+S-). Model coefficients and model statistics are included in the appendix for the interested reader. In Figure 1 (left) we show the grouped ACO’s by their person years with by-group median person years included as a black diamond. A clear relationship between ACO size—measured in person years—and success is observed. The Q- ACOs (those that did not meet quality score requirements) have a strong tendency for being small. The multinomial logistic regression model clearly bears out this trend. Figure 1 (right) shows a dramatic increase in the probability of not meeting quality benchmarks as the size of the ACO shrinks. It is also interesting to note that past 10,000 person months the group membership probabilities are very stable. Past this size, few ACOs struggle with quality and cost/utilization becomes the key differentiator. The probability of achieving shared savings remains small (approximately a 20% chance) and ACO size is not associated with whether an ACO was in the Q+S- group or the Achieving group (p=0.79). In summary, ACO size has a strong association with meeting quality score thresholds, but little to no relationship with expenditures above/below the ACO benchmark set by CMS.
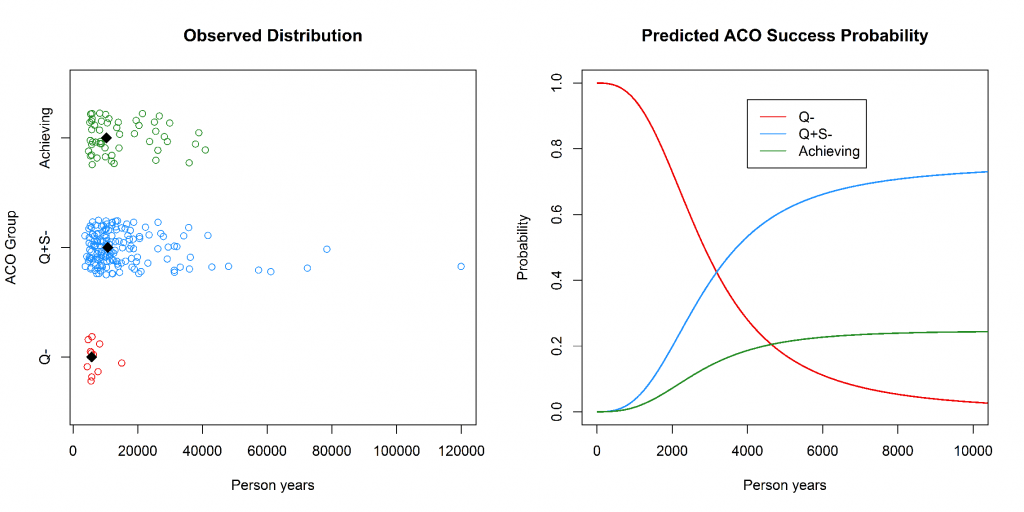
Figure 1: Left—the observed distribution of ACOs plotted by person years. Right—the predicted probability of ACO group membership as a function of person years. Person years is truncated at 15,000 as the probabilities remain relatively stable.
Our first analysis of the relationship between ACO size and success probability did not show an association between person years and whether an ACO with sufficient quality scores earned shared savings or not. Stated another way, there was not evidence of a systematic relationship between an ACO’s size and whether that ACO saved relative to CMS’s expenditure benchmark. We were a little surprised by this fact, as we hypothesized that economies of scale could drive savings. This led us to wonder whether CMS’s expenditure benchmarks are “fair”. CMS has used risk adjusted benchmarks to ensure that ACOs do not win or lose as a function of the baseline population health of their beneficiaries. This suggests that “fairness” is inversely proportional to the strength of association between an ACO’s expenditure benchmark set by CMS and the probability that ACO was in the Achieving group instead of the Q+S- group. We used logistic regression to determine whether such an association existed, and if so how strong the association was. The Q- group was omitted in this analysis as Q- ACO’s were not eligible for achieved savings regardless of expenditures. We found a strong association between an ACO’s per-person year expenditure benchmark and whether the ACO achieved savings (p=0.003). For each $1,000 increase in the ACO’s per-person expenditure benchmark, the odds of achieving savings were 15% higher. Model coefficients and model statistics are included in the appendix for the interested reader. Figure 2 illustrates the relationship between per-person year benchmark expenditures and group membership (Achieving vs. Q+S-). While the association is strong in a statistical sense, this association does not equate to causality. One may argue that a third variable that we have not considered has a confounding effect on both ACO group membership and the per-person expenditure benchmark.
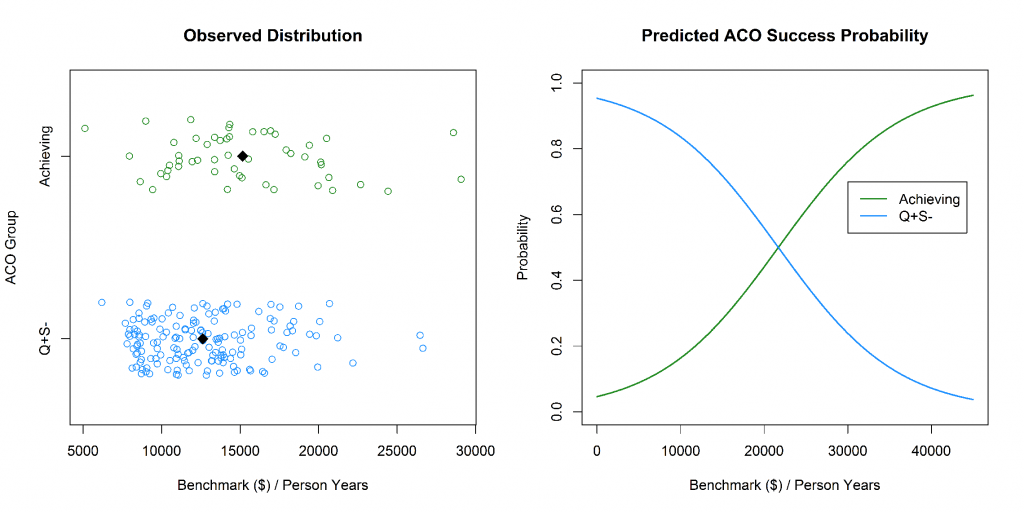
Figure 2: Left—the observed distribution of ACOs plotted by Benchmark ($)/person years. Right—the predicted probability of ACO group membership as a function of benchmark.
In addition to examining size and expenditure benchmark, we evaluated some of the other demographic factors for which data is available: race, proportion of members with disabilities, and proportion of members with end stage renal disease (ESRD). All four of these demographic factors were found to discriminate between the Q- group and both the Achieving and Q+S- groups. For race, each two fold increase in the proportion of members of non-Caucasian race predicted 2.42 times greater odds of an ACO not meeting its quality score benchmark relative to the achieving group. This trend is illustrated in Figure 3, which shows the proportion of Caucasian members by group.
Figure 3: Proportion of Caucasian Members by ACO Group
The finding that race is a predictor of an ACO meeting clinical quality score thresholds is consistent with other literature showing that non-Caucasian race predicts worse health outcomes. Proportion of members with a disability and proportion of members with end stage renal disease similarly increased the odds of not meeting quality score benchmark by 3.89 and 3.30 times relative to the achieving group, respectively. The relationship between the proportion of disabled members and ACO quality performance may suggest that member disabilities present significant challenges for ACOs in performing well in quality score domains such as “Care Coordination” and “Preventive Health”. The relationship between ESRD proportion and ACO group is informative as ESRD members are characteristically different than ACO members with traditional Medicare. Individuals with ESRD are eligible for Medicare regardless of age due to the severity of their disease and thus represent a distinct subpopulation of Medicare beneficiaries. While demographic factors explored were associated ACO quality performance, they did not differentiated between the two groups for which quality scores were sufficient to achieve savings.