Anatomy of a Successful ACO: Part 2
We continue our series Anatomy of a Successful ACO with an analysis of the cost and utilization patterns of ACOs that have achieved success as participants in the Centers for Medicare & Medicaid Services (CMS) Shared Savings Program. The monetary value of ACO success is a significant figure: In 2014 CMS paid $315.9 million to 52 out of the 220 Accountable Care Organizations in the program. In our last entry (Part 1), we presented statistical evidence that ACO size (in person years), expenditure benchmark (a CMS risk-adjusted spending per person-year benchmark), and some demographic factors (e.g. racial composition and ESRD proportion) were associated with an ACO’s probability of success. This analysis was conducted using the 2013 performance year data published by CMS. In Part 1 we defined three groups that allowed for discrete characterization of success versus failure. Our first group, nicknamed “Achieving”, consisted of ACOs that attained sufficient quality scores to be eligible for shared savings and actually achieved savings (i.e. expenditures attributed to the ACO were below the risk-adjusted benchmark set by CMS). The non-achieving ACOs were further broken down into two groups: ACOs with quality scores insufficient to be eligible for shared savings, denoted “Q-”, and ACOs with sufficient quality scores but with attributed expenditures over benchmark, denoted “Q+S-”. The distribution of ACOs was as follows: 52 ACOs were “Achieving”, 157 ACOs were in the Q+S- group, and 11 ACOs were in the Q- group.
Examining the distribution of ACOs into these three groups in Part 1 showed that the most significant business problem facing an average ACO is not delivering sufficient clinical quality (“sufficient” meaning passing CMS quality score requirements), but rather controlling utilization and per person-year expenditures so that savings above the minimum savings rate were achieved. In this analysis we determined which factors from CMS data were associated with percentage savings (or loss) relative to an ACO’s risk-adjusted expenditure benchmark set by CMS. In this post we first identify the factors that are associated with CMS’s risk-adjusted expenditure benchmarks. Next we provide an overview of the technical process involved in building a regression model for savings percentage. This section, “Building a Savings Percentage Regression Model” can be skipped by those with a greater appetite for the strategic findings than the nitty gritty details data scientists enjoy. Finally, we discuss what the model tells us about the cost, utilization, and population factors that, on average, differentiated the ACOs that achieved significant shared savings from those that did not.
1. CMS determined risk-adjusted expenditure benchmarks were a strong determinant of the percentage savings an ACO achieved and hence the amount of shared savings an ACO received.
2. Risk-adjusted expenditure benchmarks may not be proportional to the true “risk” of an ACO’s beneficiaries. There is evidence that the methodology CMS uses in determining benchmarks is not well calibrated for its purported task.
3. Increased Skilled Nursing Facility (SNF) utilization is associated with reduced savings percentage while increased Home Health utilization is positively associated with increased savings percentage.
4. Reduction in Emergency Department visit rate (not leading to inpatient admission) is associated with increased savings percentage.
Risk-adjusted expenditure benchmarks are a fundamental component of the ACO Shared Savings Program. If the expenditure benchmarks were not risk adjusted then a substantial portion of an ACO’s success (or failure) would be driven by features of an ACO’s population that are not under the ACO’s control such as age, race, and baseline population health. While CMS has made the methodology for computing these benchmarks public, many of the inputs to these calculations are not in the public domain. Consequently, we constructed a linear model to determine which factors were associated with benchmarks. The variables that contribute most are shown in Table 1. The variables fall into one of three categories: (1) demographics, (2) expenditures, and (3) quality scores that measure performance across important chronic conditions. The last category is likely a proxy for the proportion of beneficiaries with the given chronic condition that factors into the quality score denominator. Current per person-year expenditures are strong determinants of risk-adjusted benchmarks as past year expenditures are a weighted component of an ACO’s future risk-adjusted expenditure benchmark.
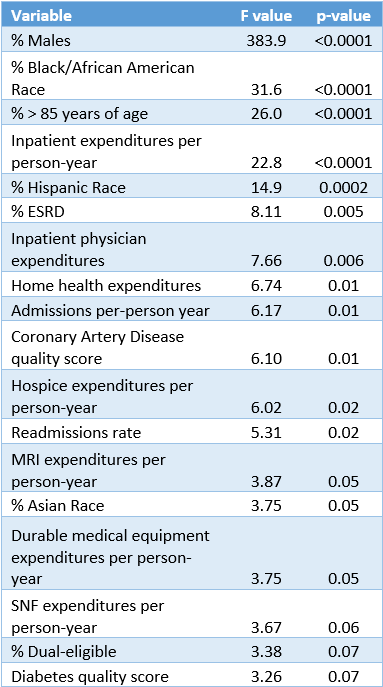
Table 1: Top variables associated with Risk-Adjusted Benchmark
An ACO’s expenditure benchmark is not of interest in itself, but rather serves as the target that an ACO must reduce costs below in order to receive shared savings. The CMS ACO performance data contains a plethora of variables that may be related to savings percentage (% savings relative to CMS expenditure benchmark). For most of these variables, multiple hypothesized relationships are plausible. For example, one might hypothesize that higher home health utilization increases an ACO’s savings percentage as it may be an exchangeable form of healthcare delivery for more expensive skilled nursing facility (SNF) care. In fact, the suggestion that in some cases home health care may be exchangeable for SNF care has been made by CMS. Contrastingly, one might hypothesize that a relative increase in home health utilization simply results in a decrease in savings percentage as it increases total expenditures. Ultimately we want to use the data to confirm or deny hypotheses that we conjure up, as well as to reveal associations that we have not posited. To do this we must build regression models that contain multiple independent variables to examine the effect on a single dependent variable such as savings percentage. However, we cannot simply dump all of the variables we have into one model. The introduction of many variables into a regression model often results in “multicollinearity”. A practical definition of multicollinearity is a high degree of inter-relatedness between variables. Multicollinearity might sound like a benign word, but it can cause a total breakdown of regression modeling. Furthermore, too many variables in a model (relative to sample size) often results in unstable estimates of regression coefficients. These mathematical realities throw even the best of data scientists for a loop. In our specific case, we have 134 variables from or derived from the CMS data. All but a few of these variables could plausibly be related to the dependent variable we are interested in (savings percentage). As mentioned above, including all or most of these variables would likely cause a breakdown of the regression modelling. On the other hand, we want our data to tell us as much as possible and we do not want to omit any important variables. The key task then is selecting the minimum set of variables that do belong in our model to parsimoniously explain reality. For this we turn to a process known as LARS(LASSO)—shorthand for Least Angle Regression (Least Absolute Shrinkage and Selection Operator). The details are beyond the scope of this post—interested readers can consult Efron, Hastie, Johnstone and Tibshirani. The general idea is that the LASSO process will shrink the “unimportant” variable coefficients to 0. A plot showing this penalized shrinkage as we construct a linear model is shown in Figure 1. An “unimportant” variable in this context may be a variable that is not related to our dependent variable (savings percentage) or one for which another variable captures the same information from our data. We used the LARS(LASSO) procedure to select the variables to include in a multivariable model for savings percentage fit by ordinary least squares.
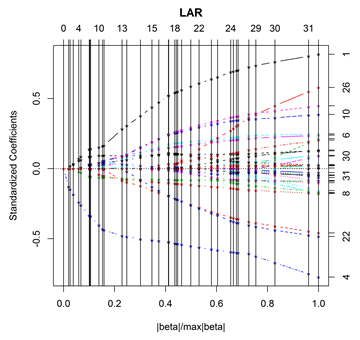
Figure 1: Plot of the Least Angle Regression coefficient paths approaching the ordinary least squares solution using the CMS data modeling savings percentage
The final model is included in Table 2. The model heralds some fascinating relationships. To start, an adjusted R^2 value of 0.437 means that the model explained about 44% of the variation in savings percentage achieved by the ACOs. We were satisfied to discover that 11 variables from the CMS data explained nearly half of the ACO performance variation. Expenditure benchmark per 1,000 person-years emerged as the most important variable in the model and was positively associated with savings percentage. This is not surprising as we found in Part 1 that for each $1,000 increase in the ACO’s per-person expenditure benchmark, the odds of achieving savings were 15% higher. This is a disconcerting fact given the implication: how successful an ACO is at managing costs is in part a function of where the cost benchmark is set. If the CMS benchmarks accurately capture the population health of an ACO’s beneficiaries, then the benchmarks should have little to do with an ACO’s success in reducing costs per beneficiary. SNF expenditures were the next most important variable in the model and were negatively associated with savings percentage. Contrastingly, home health expenditures were associated with increased savings percentage. The implication that increased home health expenditures per beneficiary are associated with greater savings while SNF expenditures are associated with reduced savings does support the idea that home health substitution for SNF care, when medically feasible, can help control costs. Percentage of beneficiaries who were male, disabled, or >85 years of age were all significantly associated with increased savings percentage. Given that risk-adjusted benchmark was already included in the model (thus controlling for its effect), the observed marginal effect of increasing the percentage of these demographics was increased cost savings. This demographic trend is the opposite of what one would expect given that each of these three demographic factors are associated with greater healthcare expenditures. These demographic effects taken together with the dependence of savings rate on expenditure benchmark suggest that CMS’s risk-adjustment methodology is flawed and does not accurately benchmark for the risk of a population as claimed. A positive association was also found between COPD admissions and savings percentage. It is unlikely that an increase in COPD exacerbations within a population should lead to a reduction in cost for that population. Rather the COPD admissions rate may be a proximal reporter of the proportion of the population with COPD, which is a factor considered in CMS’s risk-adjustment. Finally, an association was found between emergency department visits (not leading to inpatient admissions) and reduced savings percentage. While we cannot infer causality, this does provide evidence that an ACO that is able to reduce non-emergent emergency department visits will achieve a greater savings percentage.
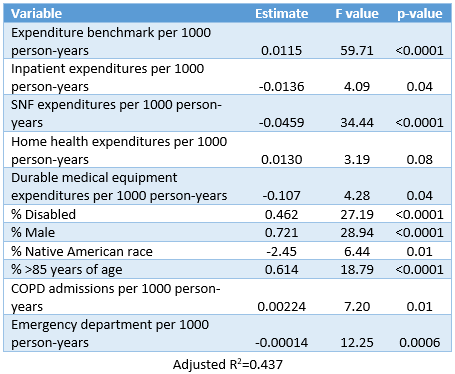
Table 2: Multivariable regression model for savings percentage
In Part 1 of Anatomy of a Successful ACO we focused on identifying the high-level attributes that discriminated between the groups we defined to allow for a discrete characterization of “success” and “failure”. In Part 2 we conducted a deep dive analysis of savings percentage as Part 1 showed that controlling expenditures relative to CMS’s benchmark was a much more significant business problem than delivering sufficient clinical quality (as measured by ACO quality measures). In our final piece, Part 3, we will study the relationship between clinical quality, expenditures, and savings percentage. This analysis is motivated by the hypothesis that some quality improvement efforts may also reduce total expenditures per beneficiary and/or increase savings percentage. If this is the case then focused quality improvement efforts in these domains may justify their costs in the form of both increased quality scores and increased savings percentage.